

Aleph Data Desktop: Create Link Analysis charts for your investigation
Link to tool: https://github.com/alephdata/datadesktop/
This latest OSINT Tool Review is quite unique in its own right as it focuses on a visual analysis tool created by an organisation that also provides an exceptional resource in the form of company data. So, to provide our readers with some context, link analysis tools such as IBM Analyst Notebook can be quite costly – especially for Digital Investigators and Intelligence Analysts who require a simple tool they can use to create link charts. There are several data visualisation tools such as Gephi that provide some link chart capability; but, when you want a tool that enables you to create a chart and select icons based on your node type (for example; persons, companies, accounts etc), then you will quickly find that Gephi is not the right tool in this case.
Here, we introduce Aleph Data Desktop, a lightweight tool that allows you to map networks of people and influence pertinent to your investigation. Taking a step back, the tool can be used alongside Aleph’s online dataset of leaked files and corporate information (which can be found at https://data.occrp.org/). This resource is truly impressive with over 250 datasets that can be readily accessed covering 140 countries / territories.
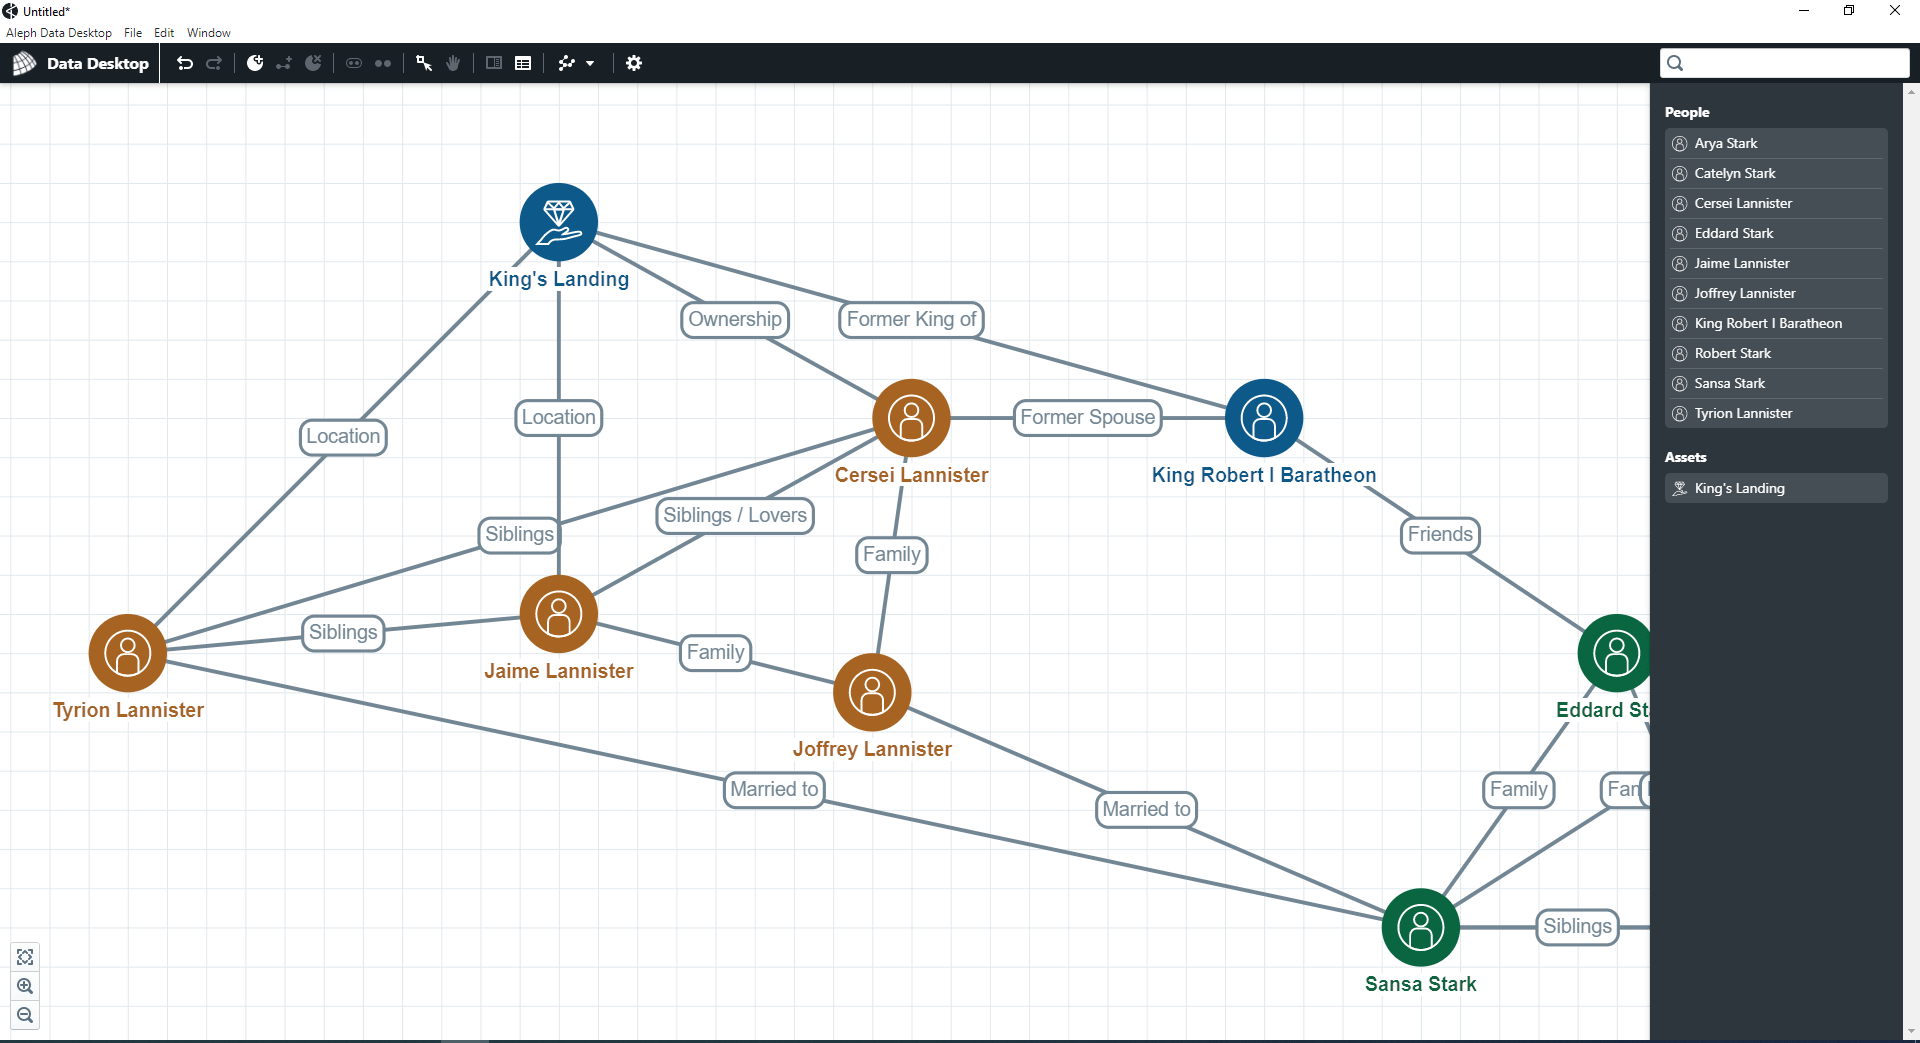
But, focusing on the capabilities of Aleph Data Desktop as a standalone tool, we have to say that it is very effective and enables Investigators and Analysts to build their own case based on individual relationships then populate nodes with information that is pertinent to the case. It is also very customisable as it allows for Investigators to modify the colour and size of nodes as well as modifying the overall view of the network charts (hierarchical, circular, vertical and horizontal alignments). The tool also allows users to create and modify nodes within a table view – which can most certainly make the task of populating data into Aleph much more easier and faster.
Link Analysis charts produced on Aleph Data Desktop can be saved as a project file, enabling Investigators to switch between files as they see fit. The chart itself can be exported as an SVG, which is a very good choice considering that JPG and PNG have their own limitations with regard to picture quality.
So, Aleph Data Desktop is a highly recommended tool for Investigators and Analysts that require a lightweight and simple capability to create Link Analysis charts. Whilst the tool can be used as a much broader case tool by allowing users to input information in relation to each node, we certainly do believe that its value lies within its user interface and its easy drag and drop functionality. Overall, this tool comes highly recommended based on its main capability, output and lightweight composition.